

Different from D1
Marsh
If we have D1, why do we also need D7 and D30? Aren't they just the same idea, stretched out?
Mallow
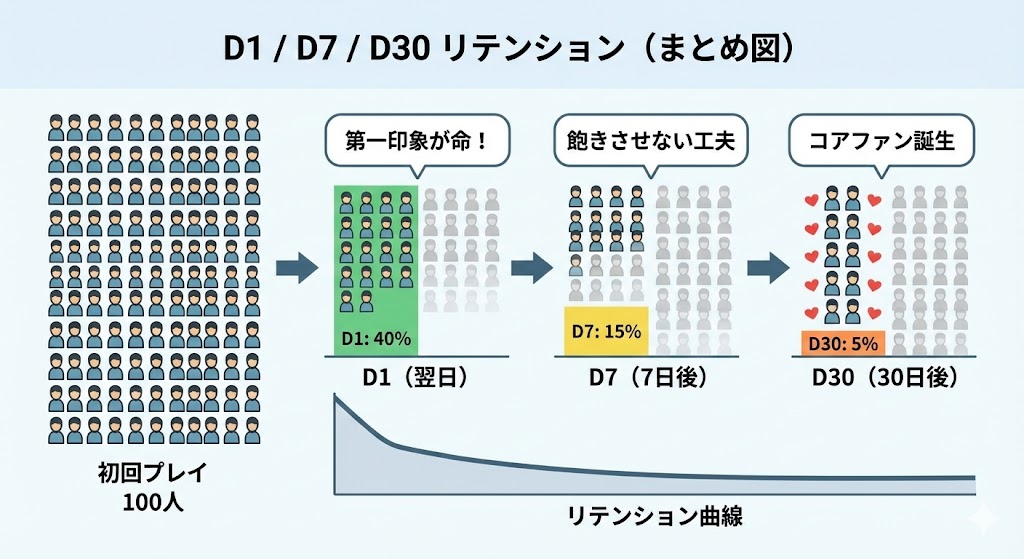
Same number family, different levers. D1 is won by "that was fun." D7 is won by "there's a reason to come back next week." D30 is won by habit formation. Three different layers of design work.
Marsh
What's a typical D7?
Mallow
Roblox median 10–15%, upper tier 20–25%. D7 is reported to be a major top-chart signal, and launch-week D7 is often where the algorithm decides "this title is going to grow."
Marsh
And D30?
Mallow
Median 3–7%, upper tier over 10%. A strong D30 stretches LTV. A broken D30 means a leaky bucket — no amount of paid acquisition fixes it. Ad-spend decisions sit on top of D30 and LTV together.
Marsh
So if our D1 is decent but D7 falls off a cliff, what's that telling us?
Mallow
The first session worked, but you didn't give them a second hook. Common cause: content runs out by day 3. Fix is content cadence — weekly events, rotating challenges, a visible progression target a week away.
Formula & benchmarks
D7 Retention = Unique returners on Day 7 ÷ Day 0 first-timers
D30 Retention = Unique returners on Day 30 ÷ Day 0 first-timers
D30 Retention = Unique returners on Day 30 ÷ Day 0 first-timers
- D7: Median 10–15%, upper 20–25%, top 30%+
- D30: Median 3–7%, upper 10%+, top 15%+
- D7/D1 ratio: A healthy curve has D7 around 30–40% of D1. Below 25% suggests no week-2 hook
- Season-based titles: D30 spikes briefly right after a new season ships
Worked example
Marsh
January cohort: 1,000 new visitors. 350 returned on D1, 80 on D7, 25 on D30. What does this curve tell us?
Mallow
D1 35% — right at Roblox median. D7 8% — slightly below median. D30 2.5% — below median. D7/D1 = 23%, which is on the weak side. Week-2 hook is missing.
Marsh
What does compounding survival look like? If D30 is 2.5%, what's D60 roughly?
Mallow
Retention curves flatten after D30 — they don't keep dropping at the same rate. Rule of thumb: D60 is around 60–70% of D30 for a healthy title. So D30 of 2.5% → D60 around 1.5–1.8%. LTV gets crushed by that thin tail.
Marsh
So the fix is fattening the tail, not the head?
Mallow
Right. Ship a season pass, monthly meta progression, or guild-based long arcs. Whatever gives the week-2-and-beyond players something to chase.
Reading it in Roblox
Creator Hub Analytics displays D1/D7/D30 separately in the Engagement section. To see the full curve shape (D0 → D60 → D90), pull raw events via Open Cloud APIs and chart them yourself, or use external analytics. Pay attention to the D7/D1 ratio — Creator Hub shows the absolute numbers but doesn’t compute the ratio, which is often the most diagnostic single number for “what’s broken.”
Common misconceptions
- "D30 just keeps dropping forever" isn't accurate: Healthy retention curves flatten after D30. If yours keeps falling at the same rate, you have a content cadence problem, not a base-quality one.
- "Higher D7 always means higher D30" isn't guaranteed: Some titles aggressively front-load engagement (week-1 events) and then collapse. Look at the whole curve, not single points.
- D30 is a 30-day-old number: By definition it lags. For real-time decisions, leading proxies (D7, payer cohorts) move first.
Related metrics
- Day 1 Retention: Short-term interest, usually read alongside
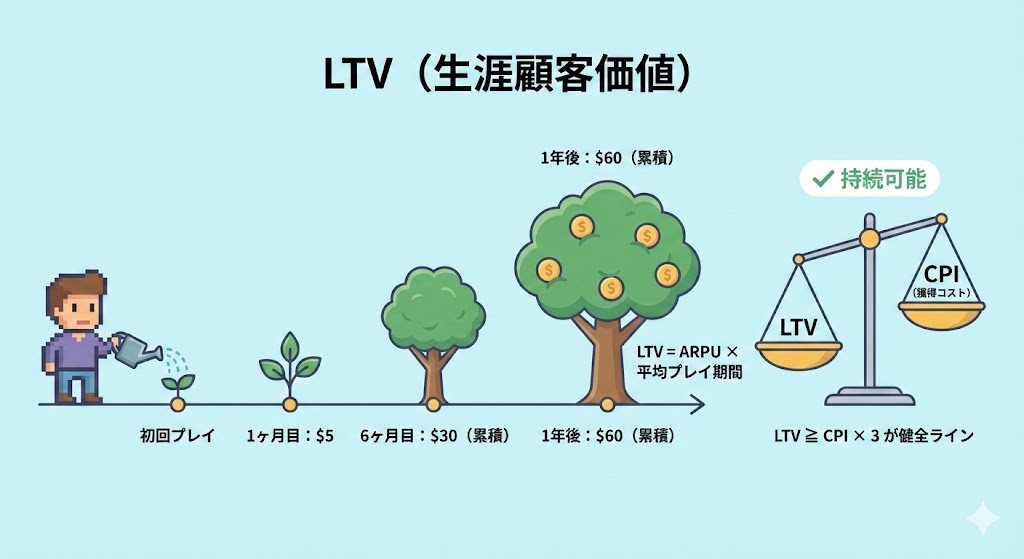
- LTV: D30 is its base input
- Cohort Analysis: D7/D30 viewed by cohort isolates the effect of specific changes
- Stickiness: Among returning players, how often they come back
- Churn Rate: The inverse view of the same retention curve