

Retention from the other side
Marsh
How is Churn Rate different from Retention?
Mallow
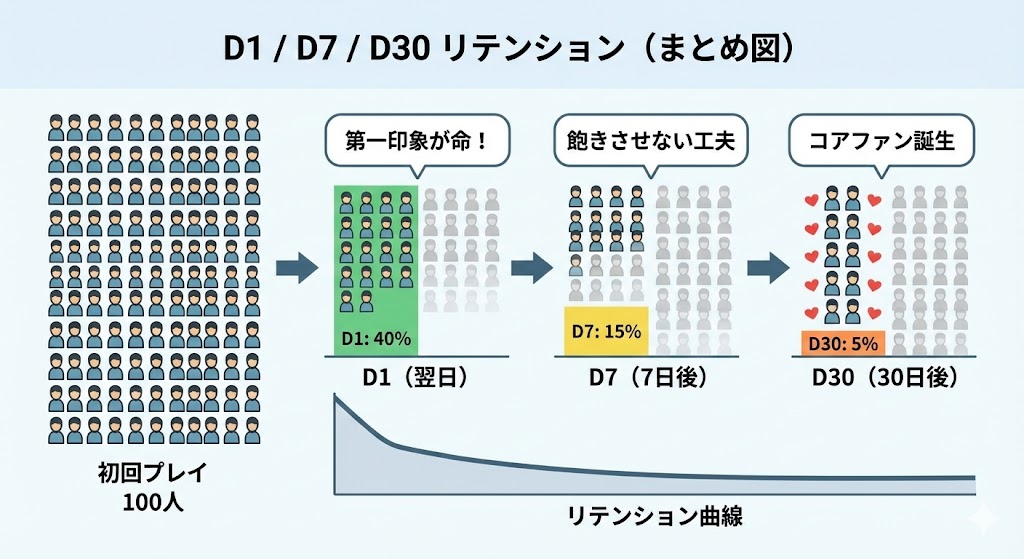
It's the same number, read from the opposite direction. Retention 35% = Churn Rate 65%. Not a new measurement — just a different way to phrase it.
Marsh
So why bother having both?
Mallow
Different listeners hear them differently. Saying "D1 Retention is 35%" to an exec carries less weight than "65% drop off after the first day." Conversely, when you ship a win, "retention is up 8 points" feels positive. Same number, different temperature.
Marsh
Is monthly churn a number people care about, or just daily?
Mallow
Both. Monthly churn is the one execs anchor on because it compounds visibly. Daily churn drives the design discussion — where in the first session people leave.
Marsh
So the levers are the same?
Mallow
Same set. But Churn framing tends to pull the analysis toward why people left — exit surveys, looking at the last session before drop-off, stage-by-stage churn (tutorial drop, purchase-screen drop, etc.). Useful for diagnostic deep dives.
Formula & benchmarks
Churn Rate = 1 − Retention
Example: D1 Retention 35% ⇔ D1 Churn 65%
Example: D1 Retention 35% ⇔ D1 Churn 65%
- D1 Churn 80%+: Severe drop-off. First-session design is the bottleneck
- D1 Churn 60–75%: Roblox median range — typical, not great
- D1 Churn 40–55%: Strong (matches D1 Retention 45–60%)
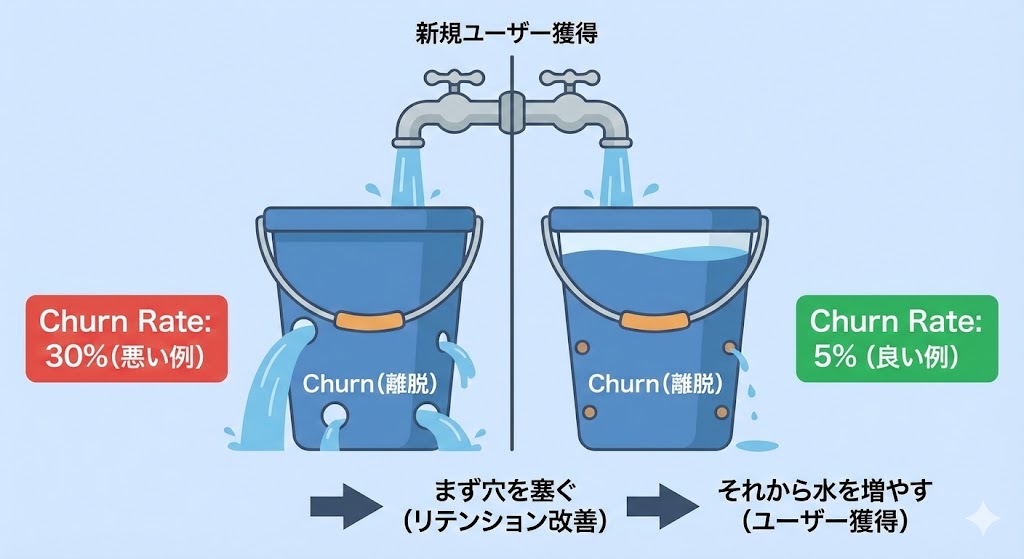
- Monthly Churn 30%: One-third of the audience leaves per month. Over six months, fewer than 12% of a cohort remains if churn stays flat
Worked example
Marsh
Our monthly churn rate is 30%. That doesn't sound terrible.
Mallow
Compounded over six months, only 12% of your starting cohort is left. 70% × 70% × 70% × 70% × 70% × 70% = 0.117. That's the trap with churn.
Marsh
12% from 100%. So if 10,000 people joined in January, by July only 1,200 of them still play?
Mallow
Right. To grow MAU, you need new arrivals to outpace that decay. Either drop churn or accelerate acquisition. Cutting monthly churn from 30% to 20% means 6-month survival jumps from 12% to 26%. More than double.
Marsh
So small churn changes have huge downstream effects.
Mallow
Exactly. That's why one-percentage-point retention wins are worth shipping.
Reading it in Roblox
Roblox Creator Hub doesn’t display Churn Rate directly. You derive it from the Retention chart in the Analytics tab: 1 minus the displayed D1/D7/D30 number gives you the corresponding churn. For monthly churn at the cohort level, use Cohort Analysis: take a month’s first-visit cohort and check what share is still active 30 days out. External tools like RoMonitor will compute compound monthly churn over a window for you.
Common misconceptions
- "Low churn means everyone is happy" — not necessarily: If most of your MAU only visits once a month anyway, "30-day churn" looks great while the experience is actually dead. Pair with Stickiness.
- Daily and monthly churn are not interchangeable: Daily churn compounds much faster. A 5% daily churn is a 78% monthly churn (1 − 0.95³⁰). Always state the window.
- Churn isn't a single number — it shifts by cohort: Paid traffic cohorts often churn faster than organic. Average churn hides that. Slice by source.
Related metrics
- Day 1 Retention: D1 Churn = 1 − D1 Retention
- Day 7 / Day 30 Retention: Each has a corresponding Churn reading
- Drop-off funnel: Tutorial-drop, purchase-screen-drop, etc. — stage-level churn analysis
- Cohort Analysis: Churn compared across signup months is where you spot a regression
- LTV: High churn collapses LTV. The two move together